

Clinical study · Evidence in progress
Rigorousclinical researchin healthy adults.
A 12-month clinical phase within a four-year T-Booster R&D programme, involving 260 adults across two randomised, double-blind studies with placebo and dose comparisons.

01 · Programme architecture
One programme.Two clinical studies.
A 12-month controlled clinical phase within the wider four-year T-Booster R&D programme involved 260 healthy adults at BSMMU, Dhaka.
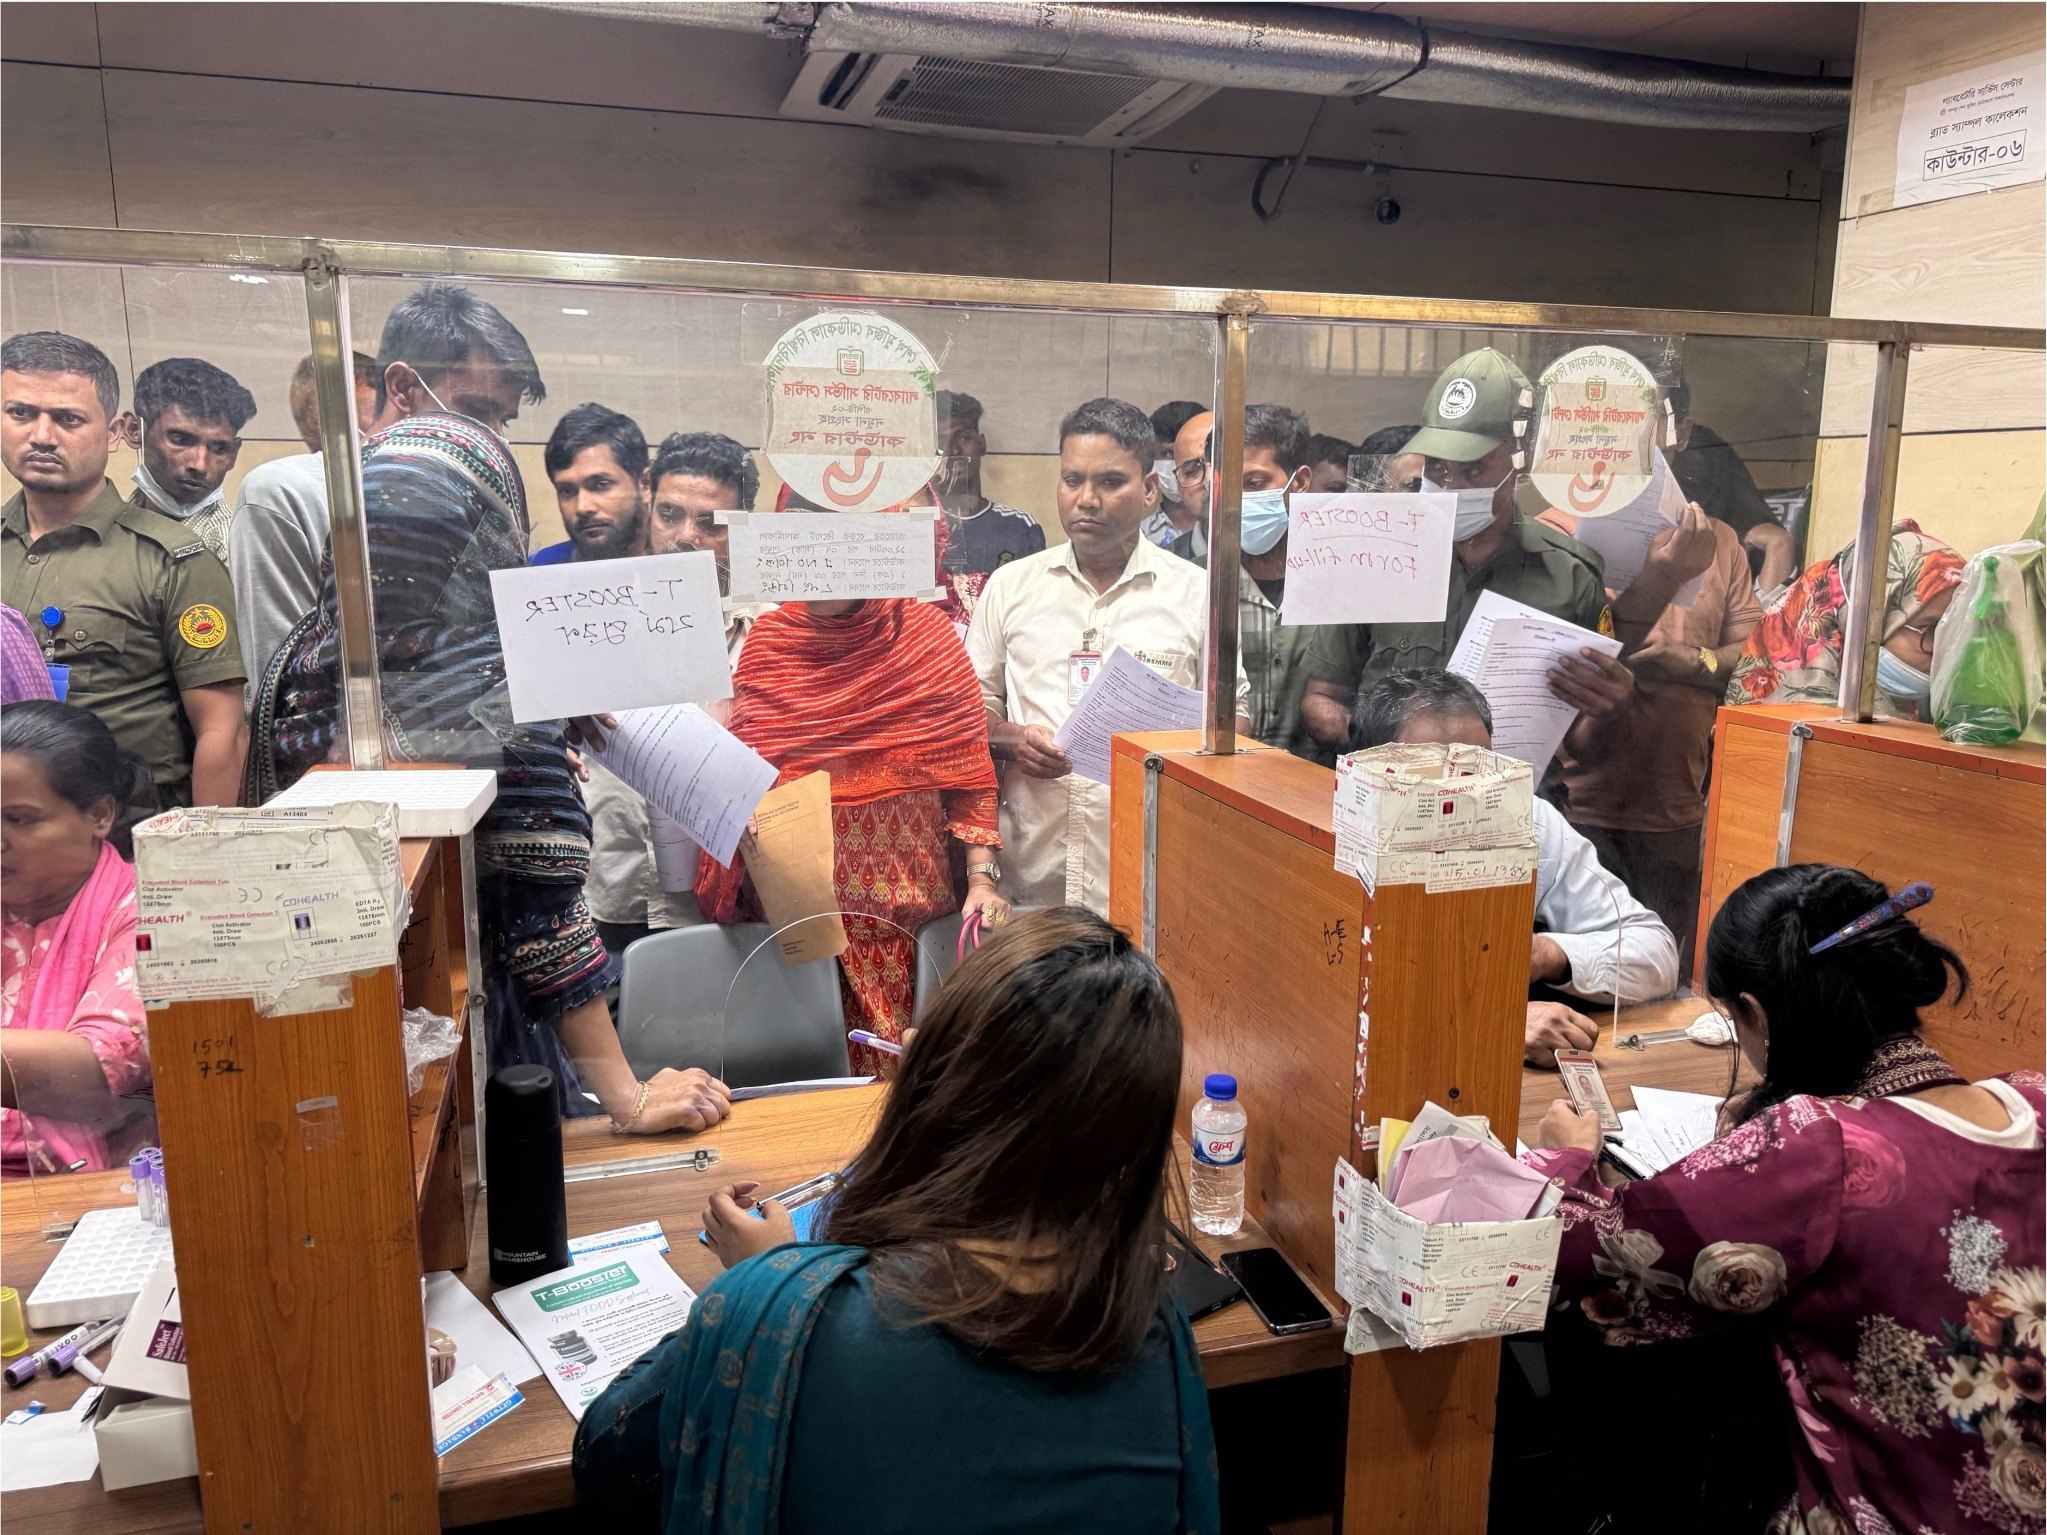
Study design
Randomised and double-blind.
Comparators
Placebo and dose comparisons.
Assessment points
Baseline and four-month assessments.
Study site
BSMMU, Dhaka.
02 · Participant pathway
From screening to scientific interpretation.
The same sequence was used across the programme so baseline and four-month assessments could be compared consistently.
-
01
Screening and consent
Eligibility review andwritten informed consentbefore enrolment.
-
02
Randomisation
Blinded allocation toT-Booster or placebostudy groups.
-
03
Baseline assessment
Blood sample andlifestyle questionnaireat programme entry.
-
04
Four-month intervention
Daily assigned capsuleswith blinded follow-upfor four months.
-
05
End assessment
Repeat blood sampleand follow-upquestionnaire.
-
06
Scientific analysis
Group comparison,statistical analysisand reporting.
6 mL
blood collected at baseline and at the end of the study
03 · Evidence framework
Three evidence streams, interpreted together.
The programme combined biological measurement with participant-reported experience. Each stream answers a different question and adds context to the others.
Thymic output
TREC DNA
An indirect marker associated with newly generated T-cell output.
Blood context
CBC and lymphocytes
Wider blood measures provide biological context for the analysis.
Participant experience
Lifestyle questionnaire
Repeated questionnaires captured changes participants noticed in everyday wellbeing.
04 · T-Booster thymus output
T-Booster boostedthymus output.
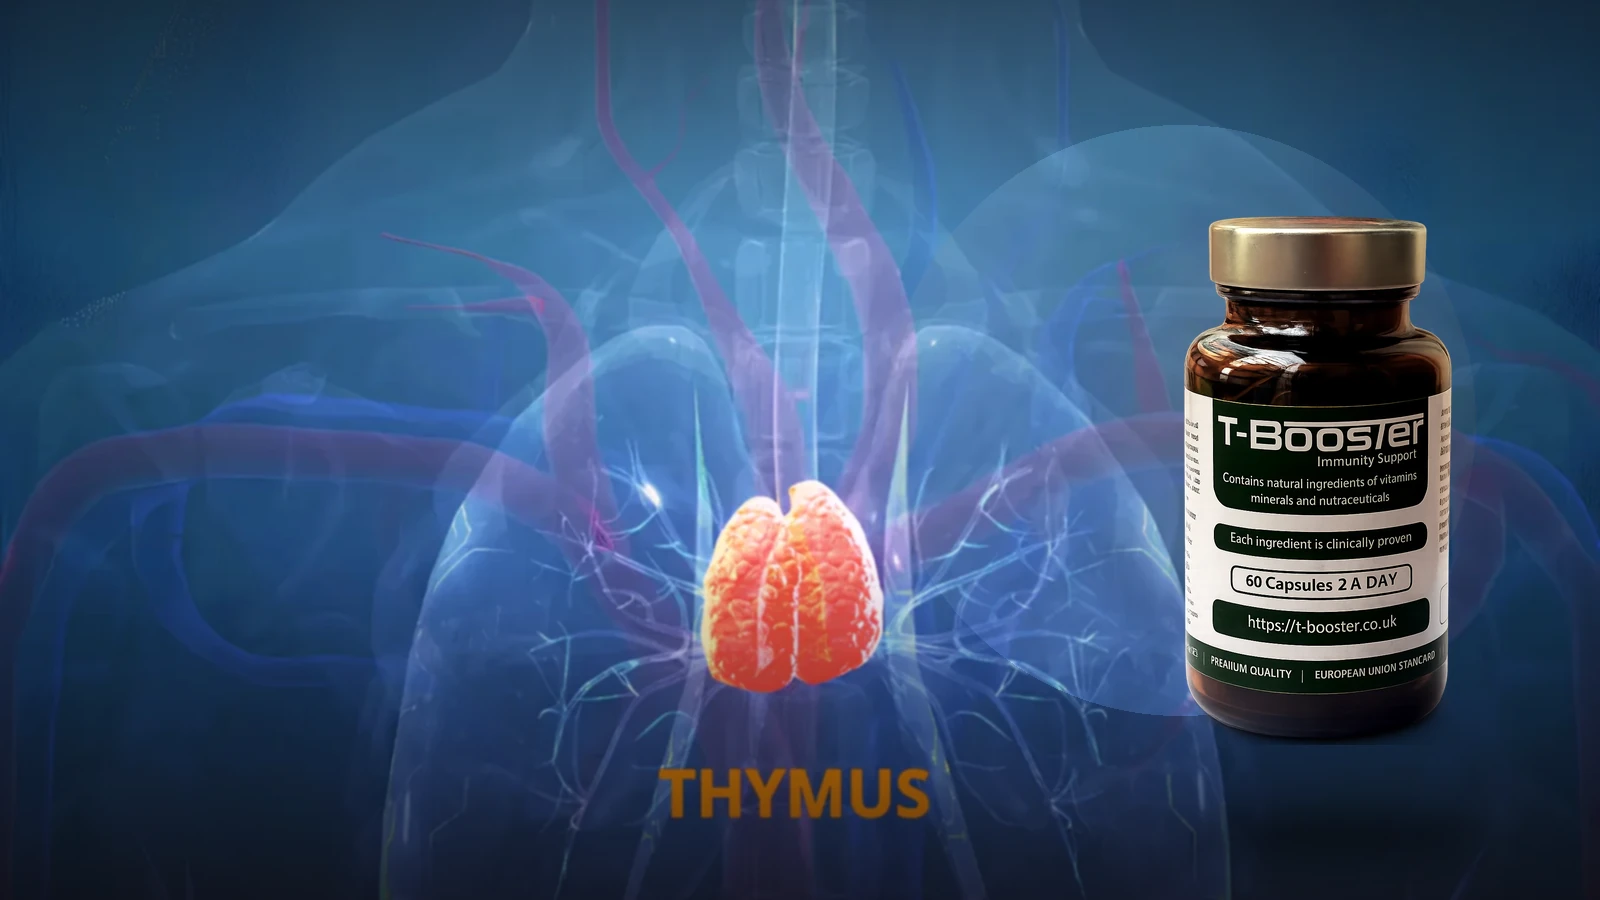
TREC DNA is an indirect laboratory marker associated with recent thymic activity and newly generated T-cell output.
After four months, TREC DNA was higher than baseline in the T-Booster group across all five adult age groups, while placebo stayed close to baseline. The largest observed increase was in ages 48–57.
What is measuredTREC DNA · indirect marker of recent thymic activity
Observed acrossAll five adult age groups
Largest observed increaseAges 48–57 · +34.28%
Higher TREC DNA is consistent with a stronger thymus-output signal. Final statistical interpretation, publication and peer review remain in progress.
TREC DNA · preliminary age analysis
TREC DNA increased from baseline after four months
Placebo remained close to baseline across every age group.
| Age group | Baseline | Placebo | T-Booster after four months | Increase from baseline |
|---|---|---|---|---|
| 18–27 | 39.80 | 39.55 | 43.51 | 9.32% |
| 28–37 | 25.78 | 25.44 | 29.53 | 14.55% |
| 38–47 | 17.29 | 16.98 | 21.77 | 25.91% |
| 48–57 | 11.67 | 11.44 | 15.67 | 34.28% |
| 58+ | 6.72 | 6.59 | 8.05 | 19.79% |
05 · Participant-reported outcomes
Improvement ratesby concern.
The percentages below refer only to participants who reported that specific concern at baseline. They show the proportion of that subgroup who reported improvement at the four-month assessment.
Base: participants reporting each concern at baseline
Sleep80%
Urinary76%
Energy75%
Mood75%
Sexual75%
Pain73%
Skin68%
Stress48%
These are participant-reported outcomes from baseline-defined subgroups and provide context; they should not be interpreted as proof of clinical effect.
06 · The programme on film
Two perspectives on the programme.
One film explains the research programme in public; the other records participant perspectives from inside the study.
 Film 01
Programme overview · YouTube
The research story in public view.
 Film 02
Participant perspective · YouTube